November 10, 2016
Ten KPIs to ponder at year's end
BY MARK BRADLEY
 KPI stands for Key Performance Indicator, which is a number, metric or measurement designed to tell you whether you are achieving your goals — or not.
 For companies successfully tracking their KPIs, the end of each year is when all that effort starts to pay big dividends. Start comparing what you thought would happen versus what actually happened, and you’re able to pinpoint exactly where corrective action is needed.
For most landscape companies, this time of year triggers frustration. Most companies either failed to track their numbers at all, or they tracked some, but no one really trusts them. If your company belongs in either camp, make it a goal to fix this for next year. Eighty per cent of our industry lacks good handles on their numbers, or what’s going to make them successful. If you want to stay ahead of your competitors, the low-ballers, and most of the industry, you must out-think them.
There are many, many KPIs that affect our success. Safety KPIs should be front and centre, but for the purposes of this article, here are 10 specific financial KPIs that are critical to landscape businesses. They help us learn, and share, exactly where we’re succeeding and where we must improve.
Sales KPIs
Sales KPIs are the most basic, and they should be the simplest to track. If you’re not tracking any KPIs in your business, you’re likely going to start here.Sales forecast vs. actual: Compares budget sales forecast to actual revenue earned. Simply put, this KPI makes sure we sold enough work to keep our crews busy, cover our overhead and make a fair profit. If we’re short of our target, it’s likely that it stings twice. Not only will our net profit suffer, but we likely didn’t recover enough overhead, either. If you can only focus on one sales KPI, make sure this one is it. Have a sales budget and track it.
Estimates won vs. lost (by count): Divide number of estimates won by total number of estimates presented. This KPI tells us the percentage of estimates that turn into contracts. A low close rate tells us we need a better sales process (studies show that most jobs aren’t lost on price), that our business isn’t suited to our target market, or that we’re in a highly competitive market and need to better differentiate ourselves.
Estimates won vs. lost (by dollar value): Divide total dollar amount of work estimated by total dollar amount of estimates won. This KPI shows if we’re spending the right effort on the big customers. Pay careful attention to significant differences in close rate by count versus close rate by dollar value. For example, if we had a 60 per cent close rate (by number of estimates) but a 40 per cent close rate (by dollar of estimates), we know that we’re not spending enough time and effort on the big opportunities. If you have several people in your company that sell, this is a very important number to look at on an individual basis. Tip: For a more accurate picture of how you compete, exclude change orders.
Expense KPIs
Expenses are money flowing out of the business, so logically, these need to be carefully monitored and controlled.Equipment expense ratio: Divide total equipment costs by total revenue earned. This KPI gives us the percentage of revenue spent on equipment. It’s a good number on its own, but it’s a great number when looked at in combination with our labour ratio. If your labour ratio is rising (more revenue spent on payroll) and your equipment ratio is falling (less revenue spent on equipment), it’s a good indicator you should be buying equipment to improve field productivity.
Materials expense ratio: Divide total material expenses by total revenue earned. This ratio shows the percentage of our revenue spent on materials. If this number is increasing (and you’re doing the same type of work), this can help improve estimating problems or wasteful purchasing habits.
Overhead expense ratio: Divide total overhead expenses by total revenue earned. Overhead must be kept in check to keep prices competitive. Monitoring the percentage of sales spent on overhead costs is critical to staying lean and mean, and also helps you plan overhead investments or cutbacks as your total revenue grows or shrinks.
Productivity KPIs
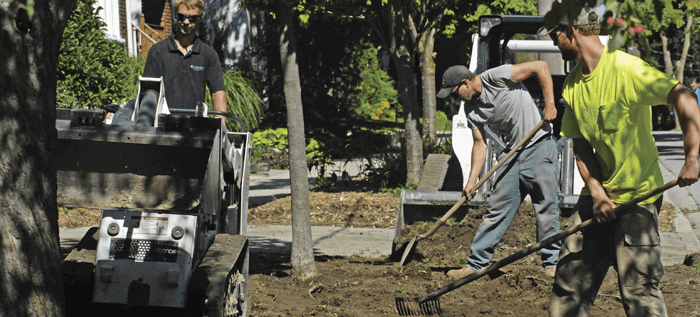
If you can sell work and you’re productive, you’re almost guaranteed to be profitable. Therefore, productivity KPIs are our next important area of focus.Field labour expense ratio: Divide total field payroll costs by total revenue earned. Do not include burden (payroll taxes, etc.). One of my favourites, this KPI measures the productivity of our field staff and the efficiency of our operations. A low percentage indicates an efficient, productive company — you’re getting more sales done with lower payroll costs. A high percentage means field payroll is eating up a larger percent of your sales revenue — a clear sign of problems. We always compare our field labour ratio to our budget (to ensure we’re as productive as planned) and to last year (to ensure we’re on a path of continuous improvement). Tip: Exclude all overhead staff salaries because you only want field staff payroll.
Revenue per man hour: Divide total revenue earned (sales) by number of payroll hours (field staff only). Here is a simple, incredibly valuable KPI. Our revenue per man hour tells us how much total revenue (includes materials, overhead recovered, and profit) is earned for each man hour worked in the field. A high number indicates more work is getting done in less time. Since skilled labour is our most important and scarce resource, you must maximize your average revenue earned every payroll hour. It’s an amazing number since it’s relatively simple to calculate using just your accounting, and it captures a lot of information. Under-estimating hours, taking too long on projects, under-bidding jobs, mistakes and re-work will all hurt our revenue per hour KPI. Tip one: Measure your revenue per hour on every job you bid by simply dividing the price of the job by the number of man hours on the job. Make sure the job meets a certain threshold to ensure that job is helping you hit your goals. Tip two: Revenue per man hour should be measured by division. Maintenance crews will have a much lower dollar per hour ratio since they don’t install much material.
Safety KPIs
Successful business owners understand that investing in safety means far more than a line item on expenses.Incidents per man hour: Number of incidents divided by total payroll hours. Incidents are ‘near misses’ and include accidents where no one gets hurt, but could have potentially got hurt — or caused minor damage to equipment or structures. It’s really important to track these incidents, to ensure we are continuously implementing measures to decrease the risk of further incidents or accidents.
Accidents per man hour: Number of accidents divided by total payroll hours. Everyone deserves to go home from work safe and sound every night, but it’s easy to take safety for granted when you’re doing the same things day-in and day-out. Every foreman’s top priority should be to keep his or her crew safe every day — this is even more important than production time or quality. Tracking this metric helps us keep tabs on whether our company is making improvements in eliminating accidents.
If measuring these KPIs quickly in your company is difficult, or even impossible, make yourself an unbreakable goal to fix this next year. Ask yourself whether some of the following questions can help make tracking a less daunting task:
Am I making things too complicated? Do I try to track metrics, but get lost in the details? Keep things simple — especially when introducing new systems — and you’ll have much better results.
Do I have the right software? Tracking KPIs with paper is like excavating without the right equipment; a shovel will work, but that driveway will take five to 10 times longer by hand than it would with a machine. Sorting through stacks of paperwork is time-consuming, and it makes mistakes five times more likely. A small investment in technology will deliver far greater returns when used correctly.
Am I holding my staff accountable? Don’t let a few staff members who refuse or resist tracking numbers hold your company down. A few bad apples will truly spoil the whole bunch. Clearly explain the systems, why they exist, then check-in regularly to ensure each person is executing the systems you’ve put in place.