January 9, 2018

Identifying the best, most profitable jobs
BY MARK BRADLEY
 In business, especially the landscape business, you have to be ready to say ‘no’ just as quickly as you are to say ‘yes’. If you want to grow a successful business in this industry, you must be able to identify the jobs that make money and those that don’t – and you need to do that long before your jobcosting. You need to identify these jobs before you even price them.
Why is that so important in landscaping? Most companies have a bottleneck: their labour. And it’s not a simple problem to solve. If you need lots of materials or equipment for a job, there are plenty of vendors that are more than happy to help solve your problem. Materials are easy to find and order and there are new and innovative products launched in our industry every year. Equipment vendors are ready and waiting to sell, lease, rent, or even rent-to-sell you equipment that will save you time.
 ADDING PEOPLE IS A PROBLEM
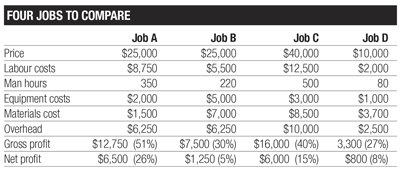
Adding more crews is another problem altogether. First you have to find good, skilled bodies looking for work. That’s a major challenge in our industry today. It’s just hard to find good people. The second challenge is that even if you can find more people they require more than just payroll costs. People need trucks, equipment and tools to do their work. At some point, you’ll need to add sales/design/operations staff to sell and manage the increased work. With enough growth, you may even need a bigger yard and shop. Adding people is a complex, multi-layered problem.Keep that in mind, but let’s go back to identifying the best jobs. Stare, just for a minute, at the ‘four jobs to compare’ table. It lists four unique jobs. Before you read any further, rank these jobs from best to worst. Use your gut, common sense, or even a calculator — but review these four jobs and try to put them in order from the best job for your company to the worst job. Take as much time as you need.
Finished? Did you write it down? This exercise is much more interesting if you actually follow along. Identifying the best job isn’t as simple as it might appear. Here’s a few common approaches:
- Net profit: Probably the most obvious approach. If your eyes went right to the bottom line, you can see Job A had the highest net profit, and Job B had the lowest. There’s the answer. Case closed. Or is it that simple?
- Gross profit: Other companies pay a lot of attention to maximizing gross profit. Since overhead is a relatively fixed number, they try to maximize their gross margins. In that case Job A would still be the best job and Job D would be the worst.
- Revenue: Job C is the biggest job, revenue wise. It’s also pretty profitable. Maybe your gut tells you that’s the best job, even if you don’t have hard numbers to back it up.
- Material cost and labour cost: If you’re really into crunching numbers, maybe you looked to see that Job D had the best ratio of materials cost to labour cost… And since materials are so much easier than labour, you went with that job.
- It’s not as easy as it seems. Each one of those jobs has different revenue, different man hours, equipment and material costs. Further complicating the issue is that they each pay down a different amount of overhead and their gross and net profit margins are different, too. Not simple. There’s a lot going on here.
 MAKE THE MOST OF YOUR LABOUR
There is another way we like to look at jobs, and that’s through the lens of our bottleneck: our available field labour hours. It’s a pretty safe assumption that for most of the readers of this article, good labour is hard to come by – and hard to add more of. If that sounds like you, then it’s imperative for you company to identify the jobs that make the best, most profitable use of your available field labour. Just to simplify this example, let’s say you only had one three person crew and you could work eight months of the year, for 40 hours a week. That’s 1,280 crew hours, or about 3,840 total available man hours (based on a three person crew) to get work done. Given a short season, and only one crew, it’s vitally important they work on the most profitable jobs possible.
If you only had 3,840 man hours, you have enough time to complete:
Job A – 11 times
Job B – 17.5 times
Job C – 7.7 times
Job D – 48.13 times
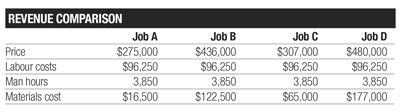
 So, what would your company’s total numbers look like if you completed each job by its number of potential times?
Job D and Job B generated a lot more revenue per man hour invested. So if we did jobs like that all year, our sales would be significantly higher than if we did jobs like A and C.
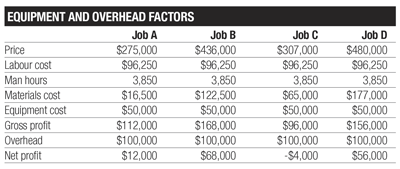
Reality kicks in when you realize crews need a truck, trailer, tools and equipment no matter which jobs they did. Your overhead costs are fixed, no matter which job you completed. So we’ll assume the same equipment and overhead costs.
That’s a big difference. If you rank the jobs now, you’ll likely prefer B, D, A, then C. Check back to your earlier exercise. Did you rank them in that order?
A MUCH QUICKER METHOD
Wouldn’t it be nice to have a number that could help you identify the best jobs without the complication of what we just did? Well there is, it’s called Throughput per hour.Throughput is a confusing word for a very simple concept. It’s the money that remains in your company after you pay your vendors their costs. It looks like this:
Selling Price - Material Costs
- Rental Costs - Subcontractor Costs
= Throughput
Since labor is our biggest bottleneck, we want to maximize our Throughput (money left in the company) per Man Hour.
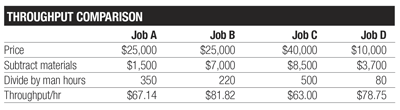 To calculate Throughput per man hour for each job we’re estimating, we simply take the job’s price, subtract our vendor costs (materials, rentals and subcontractors) and divide that number by the number of estimated man hours.
If you go back to our example jobs in the beginning of this article, we didn’t have any rentals or subcontractors, so the calculation is really easy.
Amazingly, the Throughput per hour would rank the jobs from best to worst, in the exact same order as if we had one crew to work on those jobs all year. Throughput per hour will show you the jobs that generate the most retained revenue (revenue kept by your company) per man hour worked. And since we’re all struggling to find good man hours, I believe this is another great number to have in your toolbox when analyzing the jobs that are the best fit for your company.
Mark Bradley is CEO of LMN, based in Ontario. The objective of this article is give general guidance on common financial numbers specific to the landscape industry. It is not intended to provide or act as professional financial advice.