December 15, 2016
Good decisions require good data
By Terry Murphy CLM
 Have you ever thought about the number of decisions you make in a day? Some are trivial while others may be extremely important. Many of the 200 or so decisions you make today are meaningless, such as whether to have tea or coffee with breakfast. Regardless of your decision, it really makes no major difference in your day. However, if you had to decide whether or not to sell a large amount of a stock or mutual fund when the markets open, it could have a tremendous financial impact on your life. The decision may not only impact your financial position today, but it could also affect your retirement income for years to come. For the important decisions we make, we take more time to consider more information and perhaps even seek advice from another party to ensure the best outcome. Many of the decisions we make in the damage prevention area are very important and we are very fortunate to have industry data at our fingertips to help us with those decisions. Our main tool is the Ontario Regional Common Ground Alliance’s Damage Information Reporting Tool (DIRT Report).
The DIRT Report is an industry damage prevention report that captures information from utilities who fill out a detailed information summary of an accident, whether a utility hit or a near miss. It started in the United States many years ago, as part of their State Common Ground Alliance and we have implemented the same criteria here in Ontario so we can have a history on utility hits. We record this data to improve excavation safety and by having an annual review on certain criteria, we can measure our safety performance.
I anxiously await the report each year so I can see how the green professions (landscaping, irrigation, fencing, agriculture, and waterways) perform and to learn if excavating contractors are working and are they reducing the number of hits each year. If they are not reducing the number of hits, we can determine why not. I look at two major areas of the report and investigate them thoroughly. The first is hits per 1,000 locate requests and the second is the root causes for utility hits. Both are very important industry measurement criteria and they tell a great deal about whether we are improving our safety performance. Hits per thousand tell us how busy the industry was for the last 12 months and the Root Causes tells us what area of training we need to work on immediately.
Terry Murphy can be reached at tvmurphy@ca.inter.net.
Have you ever thought about the number of decisions you make in a day? Some are trivial while others may be extremely important. Many of the 200 or so decisions you make today are meaningless, such as whether to have tea or coffee with breakfast. Regardless of your decision, it really makes no major difference in your day. However, if you had to decide whether or not to sell a large amount of a stock or mutual fund when the markets open, it could have a tremendous financial impact on your life. The decision may not only impact your financial position today, but it could also affect your retirement income for years to come. For the important decisions we make, we take more time to consider more information and perhaps even seek advice from another party to ensure the best outcome. Many of the decisions we make in the damage prevention area are very important and we are very fortunate to have industry data at our fingertips to help us with those decisions. Our main tool is the Ontario Regional Common Ground Alliance’s Damage Information Reporting Tool (DIRT Report).The DIRT Report is an industry damage prevention report that captures information from utilities who fill out a detailed information summary of an accident, whether a utility hit or a near miss. It started in the United States many years ago, as part of their State Common Ground Alliance and we have implemented the same criteria here in Ontario so we can have a history on utility hits. We record this data to improve excavation safety and by having an annual review on certain criteria, we can measure our safety performance.
I anxiously await the report each year so I can see how the green professions (landscaping, irrigation, fencing, agriculture, and waterways) perform and to learn if excavating contractors are working and are they reducing the number of hits each year. If they are not reducing the number of hits, we can determine why not. I look at two major areas of the report and investigate them thoroughly. The first is hits per 1,000 locate requests and the second is the root causes for utility hits. Both are very important industry measurement criteria and they tell a great deal about whether we are improving our safety performance. Hits per thousand tell us how busy the industry was for the last 12 months and the Root Causes tells us what area of training we need to work on immediately.
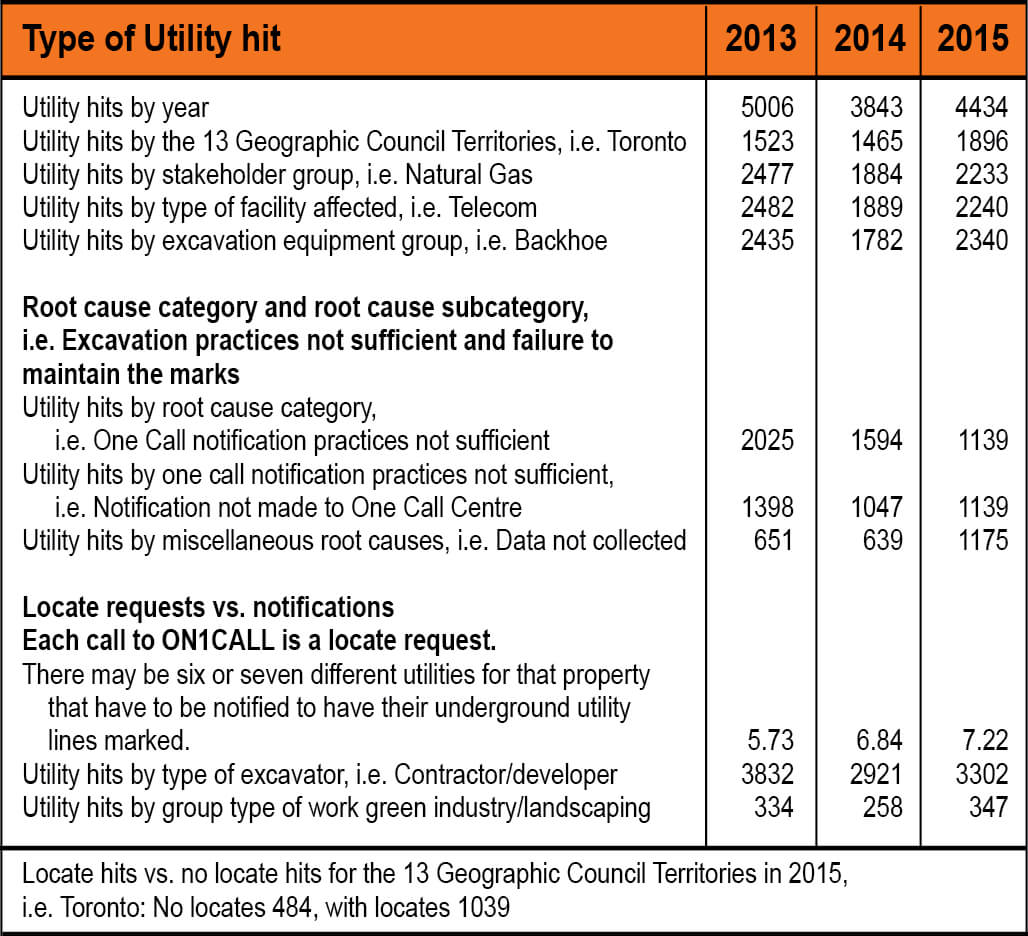
Sample DIRT Report data
Let me share with you some of the graphs and tables that are listed in the 2015 DIRT Report. You can see from this data that it is complete and gives you an extremely good look into the damage prevention world and what statistics we track.
More data
In addition, there are statistics on the utility hits for the different regions of Canada where we see how one province or area compares to another.Conclusion
The purpose of the DIRT Report is to illustrate the various types of data collected and how it is analyzed for industry improvement. The DIRT Report is a special document that enables you to compare any industry sector or region with another anywhere in Ontario. Thanks to the ORCGA and the Reporting Committee for capturing this important information, as it really helps in our year-to-year statistical comparisons. For a copy of the 2015 DIRT Report, contact your local ORCGA office.Terry Murphy can be reached at tvmurphy@ca.inter.net.